

Private credit benchmarking presents a well-documented challenge for institutional investors. The asset class encompasses an extraordinarily wide spectrum of risk profiles from conservative senior secured lending to aggressive mezzanine strategies. Yet most institutions use variations of the same basic approach: a public credit index plus a premium.
CEM recently conducted a research exercise to test whether more of the differences in returns could be captured in the benchmark. Working with data from Morningstar, we constructed portfolio-specific research benchmarks that account for both the timing differences inherent in private market valuations and the significant variation in risk across institutional portfolios. The results suggest meaningful improvements are possible, and that the range of risk in private credit portfolios may be wider than in other private asset classes.
The Challenge: more than just valuation timing
Private credit shares a valuation challenge common to all private markets. Private and public credit assets are appraised through different mechanisms. Public markets – generally – provide continuous price discovery through active trading . Private credit valuations occur monthly or quarterly, conducted by third-party appraisers. Company-specific credit spreads may lag changes in broader market conditions by weeks or months.
This temporal mismatch affects all private asset classes. Any benchmark using public market proxies must account for these timing differences through smoothing and lagging if the goal is to match the proxy to the portfolio as well as possible.
What makes private credit unusual is the heterogeneity of risk across institutional portfolios. A senior secured direct lending program bears little resemblance to a mezzanine debt strategy, yet both fall under the private credit umbrella. In our work conducting similar exercises for other private asset classes, we have not observed nearly as wide a range of underlying risk profiles – two private equity portfolios will vary in performance, but tend to have a similar level of exposure to the return of the overall private equity market. The same is not true when comparing private credit portfolios. This heterogeneity has important implications: one is that if institutions use premiums rather than customized benchmarks, those premiums should vary significantly between peers based on their specific risk exposures.
The industry’s current approach is deceptively simple: take a public credit index, potentially add a premium of 100-200 basis points, and call it a benchmark. (Or worse – take t-bills and a premium of 400-500 basis points.) While simple, this treats all private credit strategies as if they carry similar risk profiles, understates the variance of the added risk, and fails to account for the timing differences in how assets are valued.
A more nuanced methodology
For this research exercise, CEM worked with index data from Morningstar to construct and test custom benchmarks. Morningstar’s comprehensive index coverage provided the foundation for building benchmarks that could account for both timing differences and varying risk profiles.
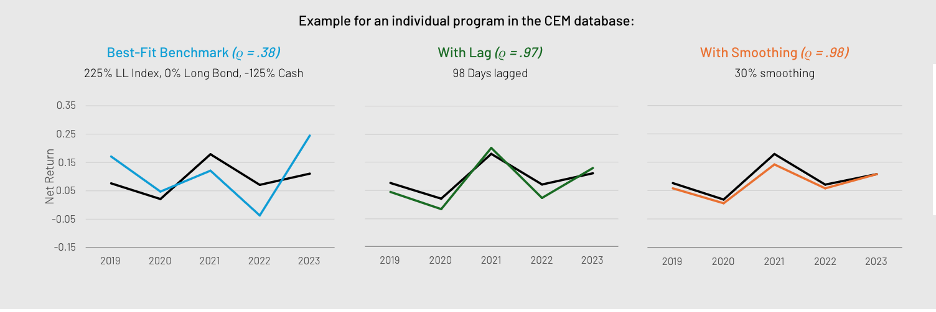
The approach adjusts public market proxies to account for timing differences through smoothing and lagging, then creates custom index mixes reflecting each program’s specific risk profile.
We selected three index components that best capture the factor loadings inherent in private credit:
Leveraged Loans (LL): These floating-rate instruments with high credit spreads form the natural foundation. Their characteristics closely mirror the core economics of most private credit strategies.
Long Bonds: This component adjusts for the presence (or absence) of duration risk in portfolios. Some strategies carry meaningful interest rate sensitivity; others are predominantly floating rate.
Cash: This allows us to reflect risk levels either above or below the leveraged loan market. A negative cash weight creates leverage in the benchmark; a positive weight indicates more conservative positioning.
These three components sum to 100%. We experimented with high-yield bond indices, but the interaction between credit spreads and duration in high yield creates complexities difficult to correct.
For each institutional portfolio, we optimize across three dimensions: the index mix, the smoothing factor, and the lag period. This creates a bespoke benchmark reflecting each program’s specific risk characteristics.
What the data reveals
When we applied this methodology and compared it to self-disclosed benchmarks in the study, the results were clear. The constructed benchmarks showed higher correlation to actual LP portfolio returns than the benchmarks institutions currently use. The median of self-disclosed benchmark correlation to actual return is 48%; the custom research benchmark increases it to 94%. While this value is boosted by being able to optimize the variables on a backward looking basis, it still demonstrates there is significant room for improvement of existing benchmarks via timing and leverage adjustments.
The analysis also confirms a wide range of risk being taken across institutional private credit programs. We observed implied leveraged loan exposures ranging from 50% to 175%.
A portfolio with 175% LL exposure is taking fundamentally different risk than one at 50%—this probably reflects the difference between a mezzanine portfolio and an investment-grade private credit portfolio. Using the same benchmark with the same premium makes no sense for portfolios this different.
Interestingly, average net value added against the constructed research benchmarks does not move significantly across different risk levels. Managers taking higher risk aren’t necessarily adding more value—they’re simply taking different risks that should be compensated differently by the market.
Implications for Institutional Investors
The implications of this research are straightforward but important:
- Consider leveraged loan-based indices as your foundation. The economic characteristics of leveraged loans—floating rate, high spread, sub-investment grade—align well with most private credit strategies. This becomes clear once timing differences are stripped away.
- Timing adjustments are necessary, not optional. Without accounting for the smoothing and lag inherent in private market valuations, you’re measuring performance against an inappropriate standard.
- Match benchmark risk to portfolio risk. If your portfolio is effectively 150% invested in credit risk through leverage or structure, your benchmark should reflect that reality. A 150% LL benchmark represents a materially tougher hurdle than a 100% LL benchmark.
- Understand when premiums make sense. If you can’t create a leveraged or customized benchmark, adding a premium to a standard index is justified—you’re compensating for the inability to properly calibrate for risk. But you cannot simply borrow a premium from your peers. A 200 basis point illiquidity premium might be perfectly appropriate for a high-risk mezzanine portfolio and completely wrong for a conservative senior secured strategy.
The analysis also confirms a wide range of risk being taken across institutional private credit programs. We observed implied leveraged loan exposures ranging from 50% to 175%.
A portfolio with 175% LL exposure is taking fundamentally different risk than one at 50%—this probably reflects the difference between a mezzanine portfolio and an investment-grade private credit portfolio. Using the same benchmark with the same premium makes no sense for portfolios this different.
Interestingly, average net value added against the constructed research benchmarks does not move significantly across different risk levels. Managers taking higher risk aren’t necessarily adding more value—they’re simply taking different risks that should be compensated differently by the market.
Conclusion
Private credit has earned its place in institutional portfolios. As allocations continue to grow—with some large pension funds now dedicating 10-15% of their portfolios to the strategy—accurate performance measurement becomes essential.
The question isn’t whether your private credit is beating “the benchmark.” The question is whether you’re using the right benchmark. As we’ve seen in other areas of institutional investing, context matters enormously. A single number rarely tells the full story.
Better benchmarking is essential for understanding whether managers are truly adding value or simply taking risk. The methodology we’ve outlined is more complex than “index plus premium,” but the payoff in accuracy makes it worthwhile.
Success lies in aligning your measurement approach with the reality of what you’re doing. The choice isn’t between high and low benchmarks, but between accurate and inaccurate ones.