

How much does it cost to invest LGPS assets? After years of effort to standardise reporting in financial statements, there is still no clear answer. Funds interpret the reporting guidance differently, estimate where data is missing, and often leave costs out altogether. The result is figures that only tell part of the story.
CEM has been collecting cost and performance information for LGPS funds for 15 years. We currently collect data from 32 of the largest LGPS funds, representing £280 billion in assets, or around 70% of total assets. We meticulously interrogate and validate the data to make sure it is organised consistently, is robust, complete and fit to be compared.
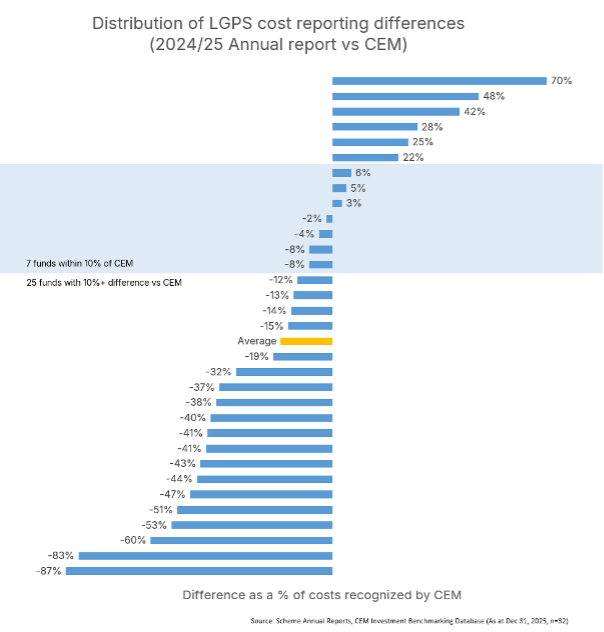
We compared the costs that the 32 funds disclosed in their financial statements with CEM’s validated figures. The gap was clear. On average, those funds understated their investment costs by 17%, and by as much as 80% in some cases.
- 23 out of 32 funds underreported their costs compared with CEM’s numbers.
- Only 7 out of 32 funds reported within 10% of CEM’s numbers.
- 2 funds reported less than 20% of CEM’s numbers.
Understated costs weaken accountability
Publicly disclosed costs are how funds are held accountable. Policy makers, members, employers and the wider industry all rely on them.
The sums involved are also significant. Based on current disclosures, the Scheme Advisory Board (SAB) estimates total investment costs across the LGPS at around £1.9 billion* in the year to March 2025. If this figure is understated, the true number is considerably higher.
There is also the question of pooling. Cost savings were one of its core objectives. If we cannot be sure how much funds spend implementing their strategies, we cannot say with confidence how much pooling is saving.
Why the numbers fall short
It’s tough for LGPS funds to report accurately. They are not to blame – multiple factors create the disclosure problem. The issues are:
Timing
Many funds prepare their accounts for audit in May or June. Much of the information they need simply isn’t available by then. This is especially true for private assets, where costs are highest and lagged reporting is a global problem. As a result, funds often estimate fees, extrapolate from partial data, or report calendar year costs rather than financial year costs. There is little consistency.
Interpretation
The guidance is complex and hard to apply consistently. Public markets are relatively straightforward. Private markets are not. Common issues include:
• Accrued versus paid performance fees
• The treatment of management fee ‘rebates’
• How and where to include ‘partnership expenses’
• Fund of funds structures: whether to include underlying manager costs. Some of the more transparent LGPS funds try to drill down, but many do not.
Process
The Scheme Advisory Board’s (SAB) Code of Transparency and the accompanying Cost Transparency Initiative (CTI) templates do not work as well as intended. Not all managers are signatories, and not all supply the data needed. Understanding of the requirements varies across the asset management community, and the data is often unreliable.
Resourcing
This is complex work, and many teams are stretched. They often rely on the expertise of one or two key individuals and it is challenging for those team members to understand the complex structures that many schemes invest through. Collating the data also falls at the busiest point in the year.
Audit
Auditing does little to close the gap. Costs often fall below the auditor’s materiality threshold, so they attract limited scrutiny. Even when they are reviewed, pension fund auditors rarely have the specialist knowledge necessary to deeply understand investment costs.
What LGPS funds can do now
None of these issues are easy to solve alone. But there are practical steps funds can take to improve the accuracy of what they report.
Plan for the timing gap. Start collecting cost data early, and be clear in the accounts where figures are estimated or based on calendar year data. Transparency about estimates is better than silent assumptions.
Focus on private markets. This is where costs are highest and where most of the gap sits. Ask managers for a full breakdown, including performance fees on an accrued basis, rebates and partnership expenses.
Look through fund of funds structures. Underlying manager costs are real costs to the fund. Demand the data from managers.
Hold managers to account on CTI templates. Make complete, timely template submissions a condition of the relationship, and follow up where data is missing or inconsistent.
Reduce key person risk. Document the process so it doesn’t depend on one or two individuals, and build in time for it ahead of the busiest period.
How CEM can help
CEM has been collecting and validating investment costs globally for 34 years. We can:
- Easily collect and validate cost information from investment managers on your behalf
- Pro-actively cover information gaps using transparent methodologies
- Output timely data in a compliant and auditable form, ready for inclusion in your financial statements
Reach out to us to learn more about how we can make your year-end just a little easier.
Fund Accounts and Net Asset Statements